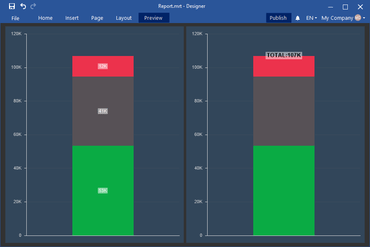
Adds the ability to show overall result for Stacked Area charts.
Features
- New Waterfall Chart - A waterfall chart is used to display a running total when you add or remove values.
- Overall Results for Stacked Area Charts - This release adds the ability to display the total for each argument in a Dashbaord Stacked Area chart.
- Dark Green Theme for Dashboards - To apply the new style, select the Dashboard and select the Dark Green theme from the styles menu.